
The short answer
A vacation rental business in Michigan finished January–October 2026 with 23% more owner income than the same months of 2025. On the six cabins it already rented in 2025, income from direct bookings grew 75%, while Airbnb, Vrbo and Booking.com together grew 1.6%. Direct channels brought 88% of those cabins’ growth.
These numbers show what changed while our systems were running. They don’t prove the systems caused every change: other things changed at the same time, and we list them below.
Owner income is what the owner receives after the booking platforms’ fees, counted by checkout date. Direct channels are the website’s booking engine, bookings the team takes itself, and Google. Data as of November 4, 2026.
The business
Six cabins that were already rented in 2025, plus a new cabin that opened on June 13, 2026. The new cabin has no 2025 to compare with, so most comparisons below use only the six original cabins. The client stays anonymous, and we show no dollar amounts.
What we built, and when
The first system went live on June 6, 2026. Each one after it added a new way for guests to reach the business or to pay it.
- June 6Chat routerAnswers the website chat, Instagram and Facebook automatically.
- June 13New cabin pagePhotos, gallery and amenities, added to the cabin pages and the home page the same day its first guests arrived.
- June 21Add-ons page fixedGuests buy kayaks, firewood, a pet fee, early check-in and late checkout.
- August 20Payment linksGuests pay for an add-on or a balance with a link.
- September 10–11Booking calendarsGuests see the open dates on each cabin’s page and book on the website.
- September 15Communications inboxEvery channel in one place for the team.
- September 27–October 9AI assistantAnswers texts, chat, social media and email, day and night.
- October 20WhatsAppGuests can message the business number on WhatsApp.
Direct bookings: where the growth came from
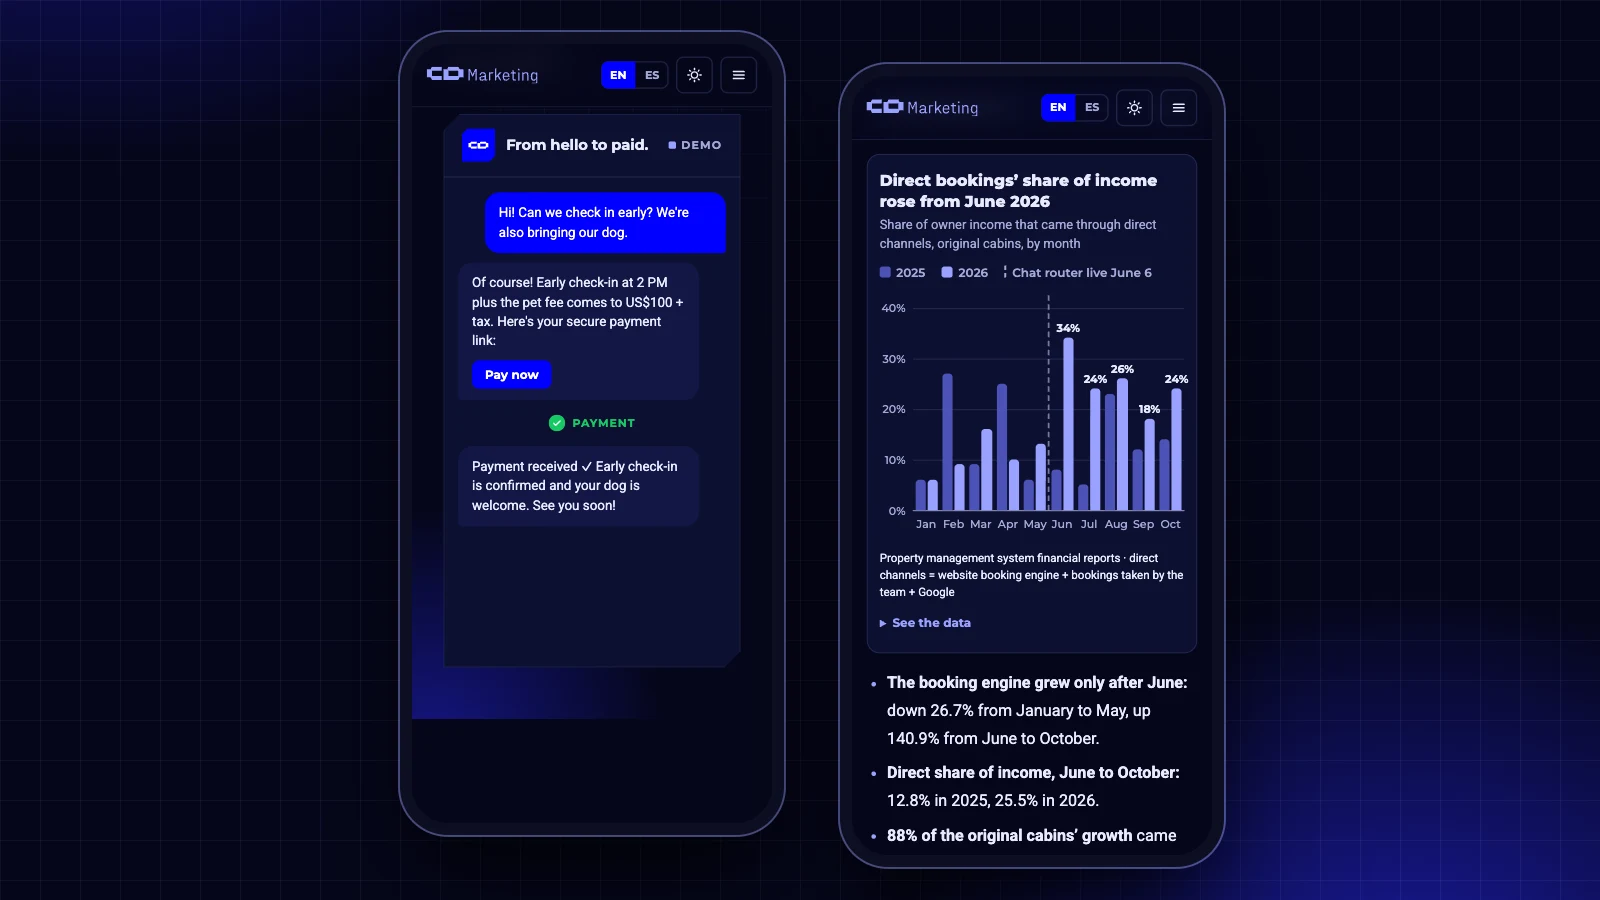
On the six original cabins, direct channels grew 75% from January to October, while the booking platforms together grew 1.6%.
| Original cabins, January–October | Change 2025 → 2026 |
|---|---|
| Website booking engine | +75% |
| Direct bookings taken by the team | +158% |
| −62.9% | |
| All direct channels | +75% |
| Airbnb | +9.1% |
| Vrbo | −1.0% |
| Booking.com | −66.7% |
| All booking platforms | +1.6% |
Property management system financial reports · direct channels = website booking engine + bookings taken by the team + Google
See the data
| Month | 2025 | 2026 |
|---|---|---|
| Jan | 6% | 6% |
| Feb | 27% | 9% |
| Mar | 9% | 16% |
| Apr | 25% | 10% |
| May | 6% | 13% |
| Jun | 8% | 34% |
| Jul | 5% | 24% |
| Aug | 23% | 26% |
| Sep | 12% | 18% |
| Oct | 14% | 24% |
- The booking engine grew only after June: down 26.7% from January to May, up 140.9% from June to October.
- Direct share of income, June to October: 12.8% in 2025, 25.5% in 2026.
- 88% of the original cabins’ growth came from direct channels, which don’t pay Airbnb’s host fee (15.5%).
The last four weeks: bookings made from October 8 to November 4 were worth 32% more than a year earlier, with 9% fewer bookings. 60% came through direct channels, against 20% a year earlier, and Airbnb fell from 70% to 30% of bookings.
The new cabin: 29% of its June–October income came through direct channels, and it already has website bookings for summer 2027.
Owner income: +23%, and where it came from
Across all cabins, owner income grew 23%. Of those 23 points, direct bookings on the original cabins added 9.8, the booking platforms 1.4 and the new cabin 11.9 (rounded).
On the original cabins, owner income grew 11% with 2.5% fewer paid nights, because the average nightly rate rose 16.5%. That growth was about the same before and after June: +13.1% from January to May, +10.1% from June to October. What changed after June was where the income came from: more of it arrived direct.
Guests got answers faster
From June to October, web chat, Instagram and Facebook messages answered within 5 minutes went from 18% to 74%. Booking-platform messages (Hostaway) that arrived at night went from 13% to 53%.
Project message logs · June 1–October 31 of each year · night = 9 p.m. to 9 a.m., Michigan time
See the data
| 2025 | 2026 | |
|---|---|---|
| Web chat, Instagram, Facebook | 18% | 74% |
| Hostaway inbox, night | 13% | 53% |
| Hostaway inbox, day | 32% | 46% |
| Text messages, night | 44% | 56% |
| Text messages, day | 45% | 50% |
| June to October | Answered within 1 hour | No reply after 3 days |
|---|---|---|
| Web chat, Instagram, Facebook | 34% → 82% | 48% → 13% |
| Hostaway inbox, night | 29% → 64% | 47% → 22% |
| Hostaway inbox, day | 47% → 62% | 38% → 24% |
| Text messages, night | 66% → 69% | 16% → 14% |
| Text messages, day | 62% → 64% | 22% → 23% |
- Night is 9 p.m. to 9 a.m., Michigan time.
- A “message” is one guest message, or several in a row, until the next reply. Scheduled automatic messages don’t count as replies.
- Guests also wrote much more: text conversations almost doubled, and web chat and social media messages quadrupled.
Add-ons: 141 orders
Guests placed 141 add-on orders from January 1 to November 4, 2026, and 93% of sales came from June on. Sales are more than 8 times the add-on charges recorded in all of 2025.
| Add-on, January 1–November 4, 2026 | Orders | Share of sales |
|---|---|---|
| Kayaks | 43 | 37% |
| Pet fee | 13 | 22% |
| Firewood | 39 | 20% |
| Late checkout | 40 | 12% |
| Early check-in | 27 | 9% |
Next year is already ahead
As of November 4, next year has 95% more bookings, in value, than 2026 had at this point last year, and 69% of it is direct (45% a year ago).
| Already booked, as of November 4 | Change vs a year earlier |
|---|---|
| Rest of this year (November 5–December 31) | +29% |
| Rest of this year, direct channels only | +91% |
| All of next year | +95% |
| Next year, direct channels only | +197% |
| Next year, without the new cabin | +36% |
November stays booked so far are 45% direct; all of November 2025 was 22% direct. Last year’s figures count only the bookings that held, so the real difference is smaller than shown.
What these numbers don’t prove
These figures show what changed while CDMarketing’s systems were running. They don’t prove the systems caused each change, because other things changed at the same time.
- Prices: nightly prices are set by a dynamic pricing tool the business has used since late 2025. Part of the higher nightly rate comes from it.
- Cancellations went up: from 8.6% to 12.7% of bookings on the original cabins.
- The new cabin opened in 2026, so the comparisons use the original cabins where it matters.
- Add-ons in 2025: only some channels’ charges were recorded, so the comparison with 2025 starts from a minimum.
What we’d tell another vacation rental owner
- Answer every channel in minutes, nights included. The biggest changes here were on web chat and social media (18% → 74% within 5 minutes) and on booking-platform messages at night (13% → 53%).
- Look at income by channel, not only the total. The original cabins grew about the same before and after June; the move to direct bookings only shows up by channel.
- Sell the extras with a link. Kayaks, firewood, pet fees and late checkouts added up to 141 orders once guests could buy them on a page or pay with a link.
We build these systems with our own code: an AI assistant for every channel, websites that take bookings and the tracking to see what works.
Sources
- Financial reports from the business’s property management system: owner income, stays, nights, channels and booking dates, pulled on November 4, 2026. Confirmed stays only.
- Add-on orders and payment link records.
- Message logs from the web chat, social media, Hostaway and text messages.
- CDMarketing’s deployment logs and archived copies of the business’s website.